Best web charting libraries
Back in the days, the popular ones were Google Charts, Charts.js, D3. What about now?
The old guard
Google Charts was nice, but it's now in maintenance mode. Charts.js seems to still be quite active. I've never tried it, so I can't give an informed opinion on it. As for D3, it's a charting library, which gives you a lot of flexibility. The drawback is that it is very low-level and you have to reimplement the wheel. This is not what I am looking for.
Higher-level libraries
I recently learned about Vega and started using it heavily to analyze Aave data. It is quite powerful and lets me define a graph with configuration instead of code. Then I stumbled upon Observable. Looks like they did heavy marketing:
- Announcement: https://news.ycombinator.com/item?id=27036768
- Comparison with Vega-Lite: https://observablehq.com/@observablehq/plot-vega-lite
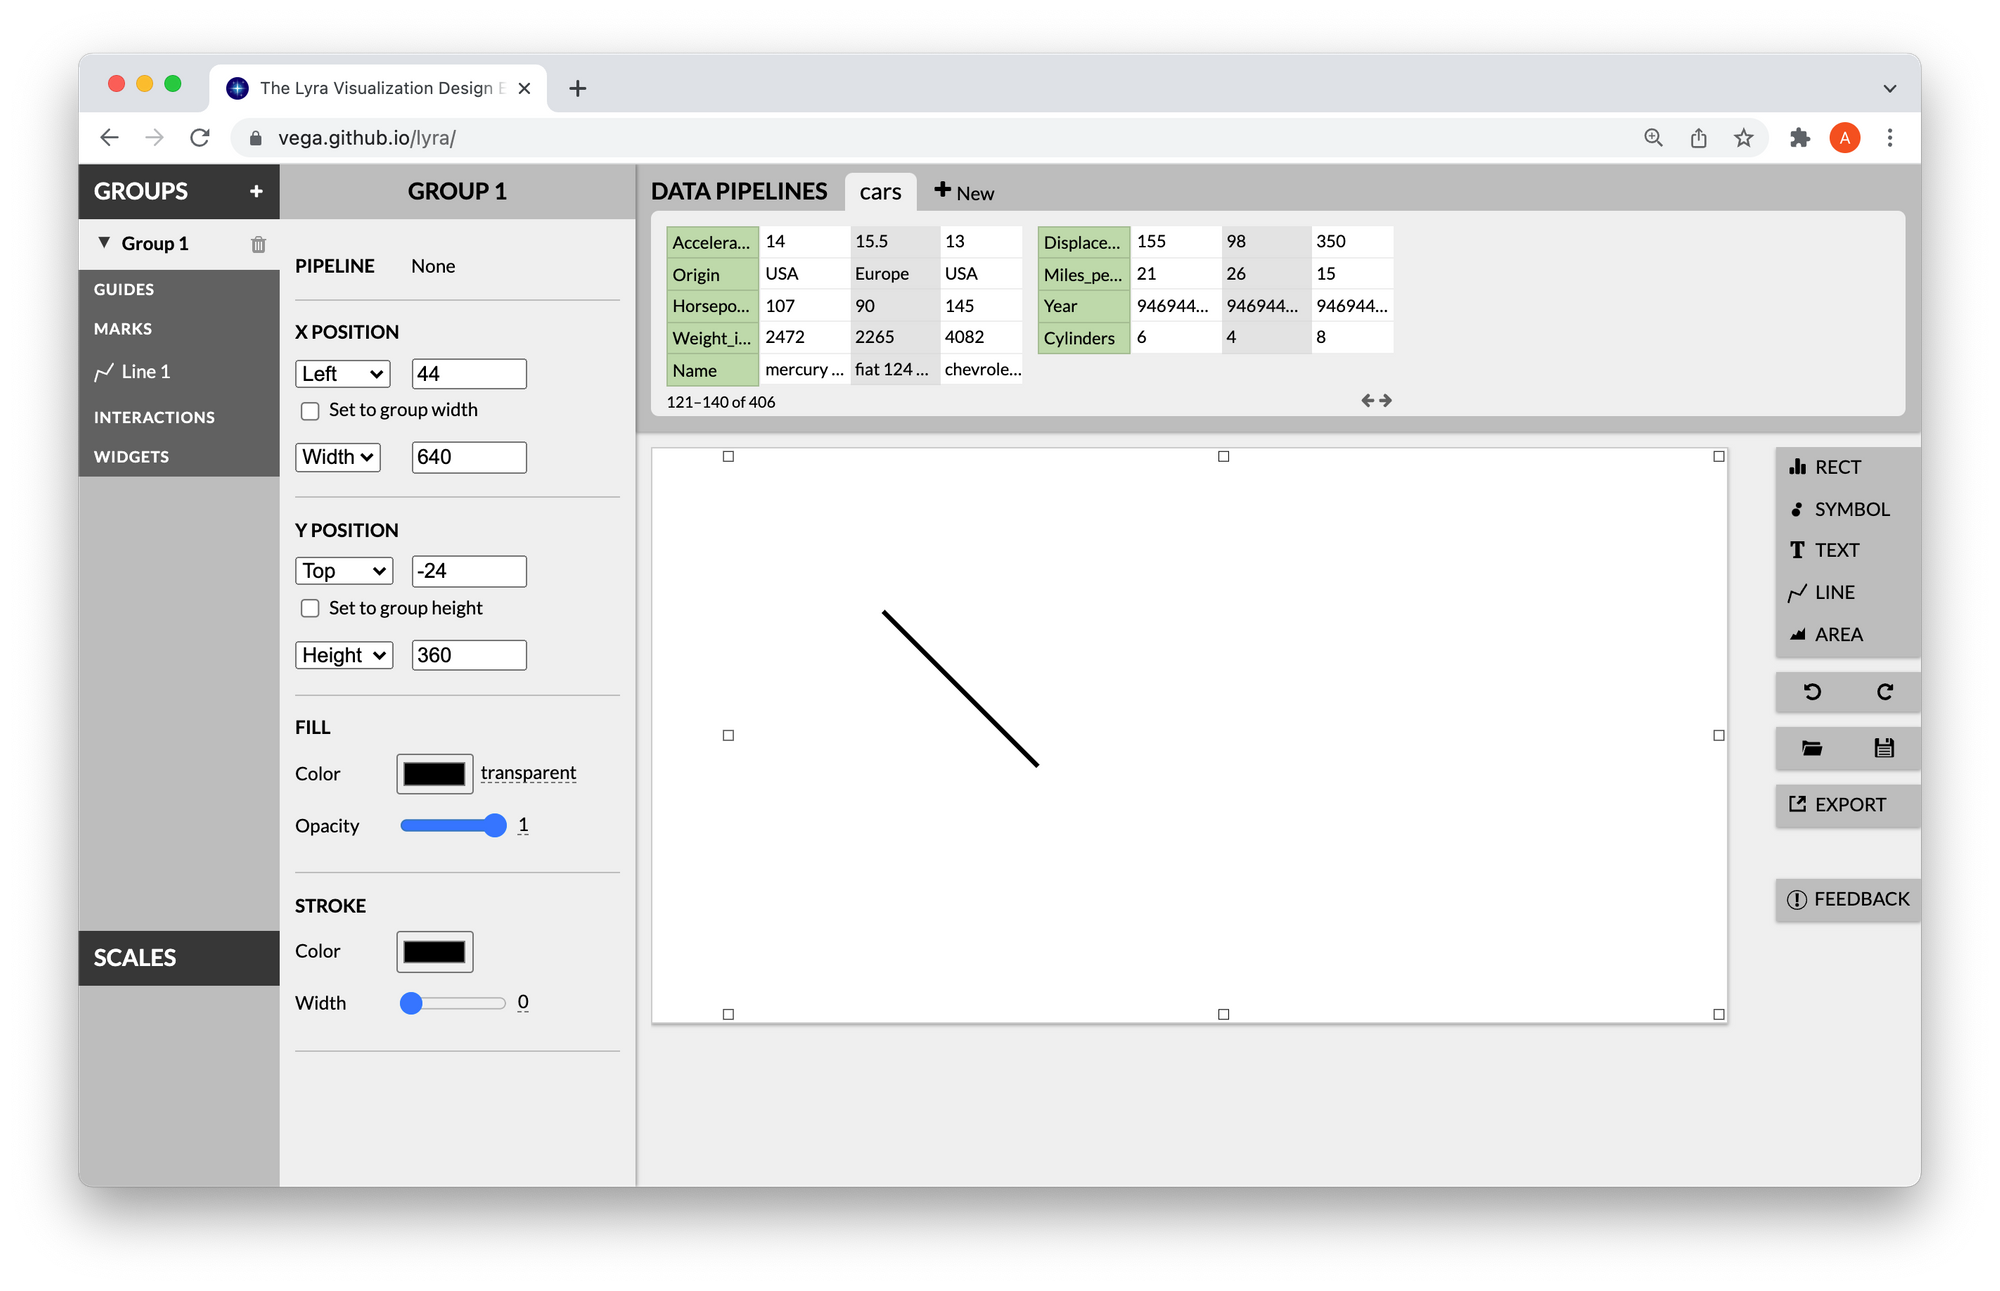
The announcement got responses from Vega-Lite users discussing the pros and cons of both. And one person mentioned a graphical tool for Vega, Lyra. I tried opening the tool, loading a dataset and making a line chart out of it, but all I got was a random hardcoded line in my canvas.