Graphics cards comparison
In the past few weeks, I've regained interest in gaming, and I got curious about laptops vs desktop graphics cards. So I made this chart.

Methodology
Data source
Initially, I just googled a few GPU models and ended up using userbenchmark.com. Here's what the page looks like for my old GTX 970 https://gpu.userbenchmark.com/Nvidia-GTX-970/Rating/2577. The website will tell you the fps in certain games depending on the resolution and the details settings, but you won't get many data points. Also, games tested are different from one graphics card to another.
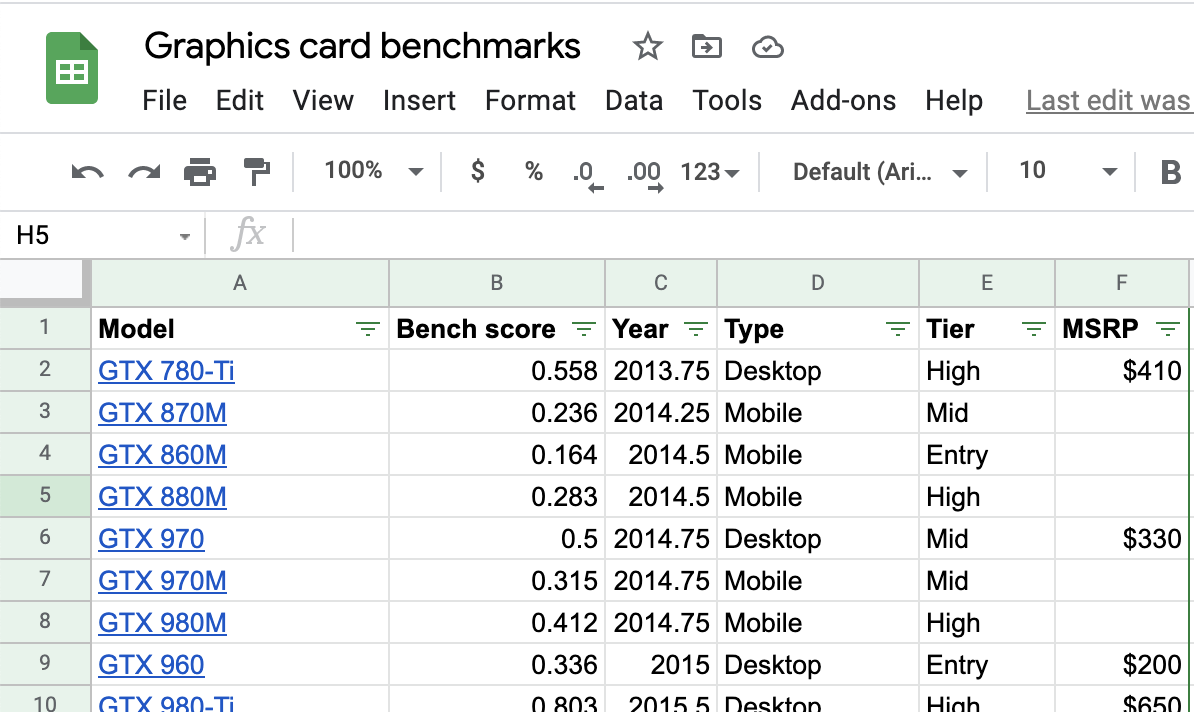
So I used the average bench percentage score instead.
There are other alternatives to userbenchmark, and I haven't tried them. For science, it'd be interesting to redraw the graph based on different benchmark websites to see how they compare.
Chart tool
I tried using Google Charts, but I was not able to plot everything I wanted to plot. Here's what I wanted to do:
- Plotting graphics cards as dots based on their release date and their performance.
- Link cards in the same price range with a line.
- Distinguish desktop and laptop GPUs.
- Add game requirements as horizontal power thresholds.
Google Charts can do the first, but it can't even put the card's name near the dot.
So instead I used Vega. Vega is an open-source software that can generate a chart based on JSON configuration. You feed it data as JSON, CSV or TSV, then you configure how to render the data.
Putting it together
I made a Google Sheet that contained all the data I wanted to plot, then exported it to TSV.
Then I published it as a gist:
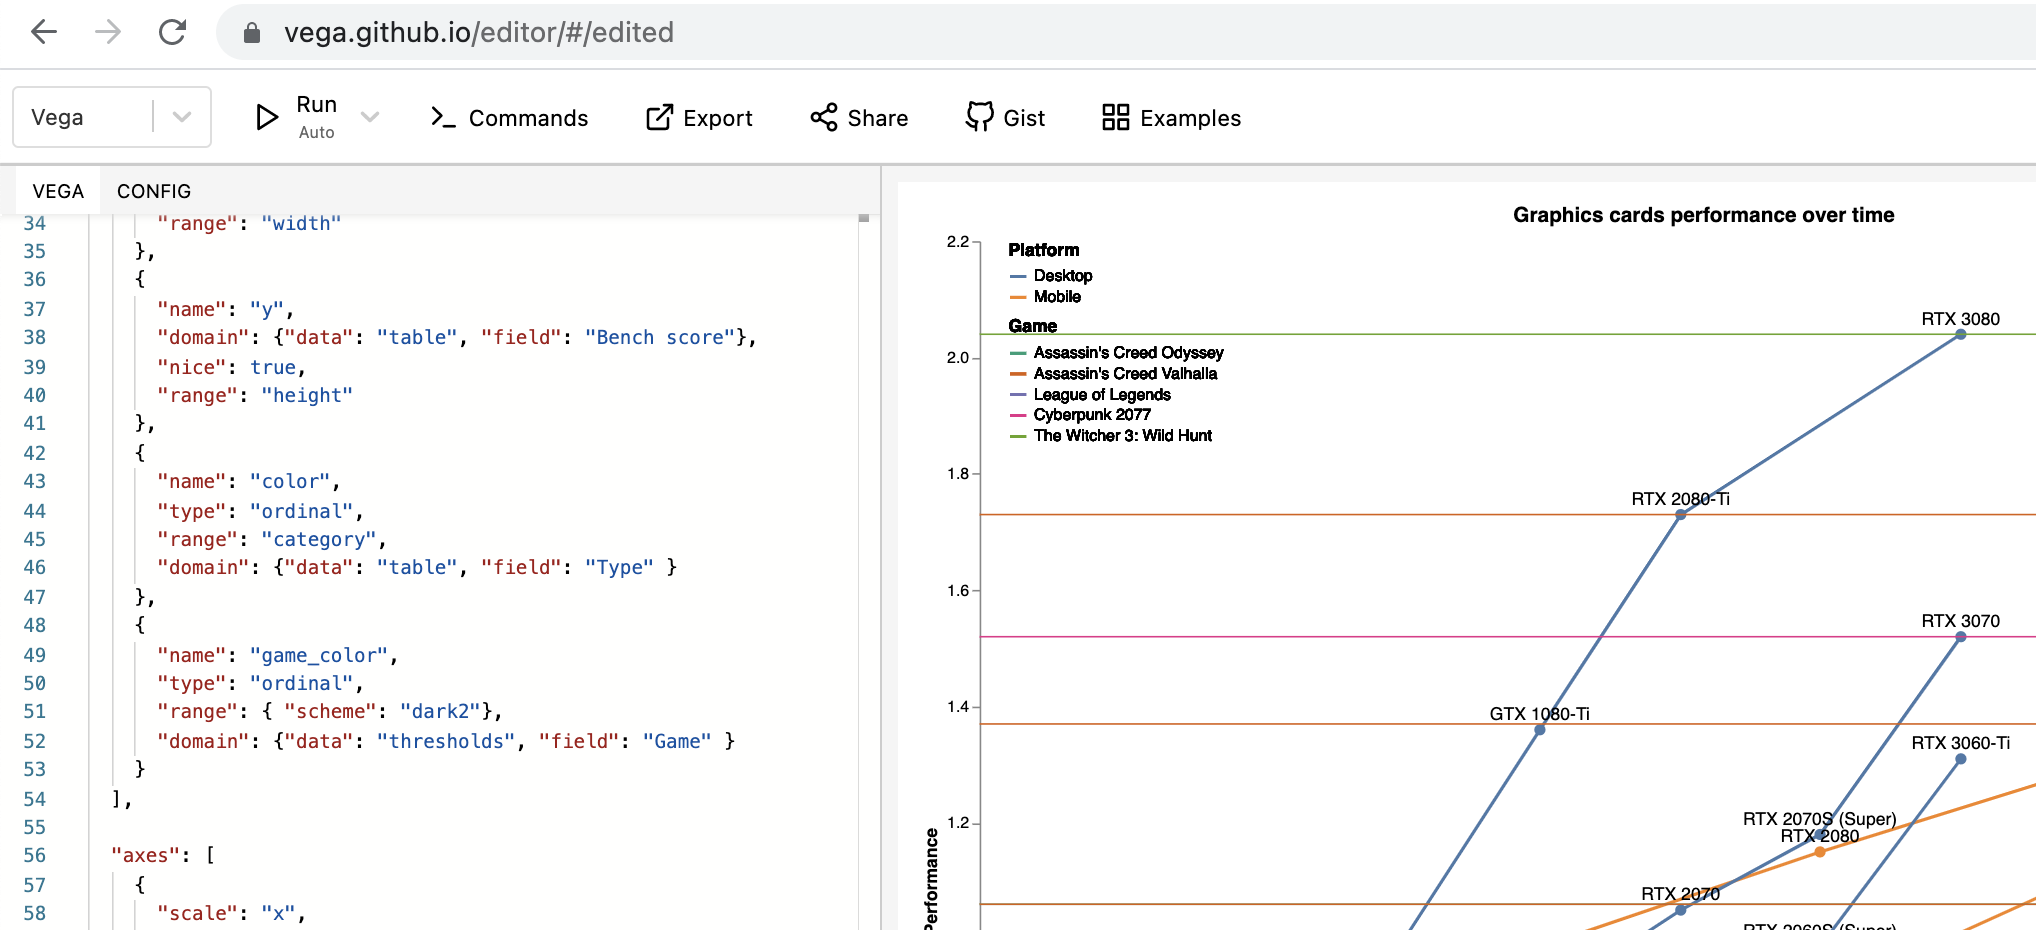
Finally I wrote the plot config in the Vega online editor.
I also saved that configuration as a gist, so you can load that gist from the vega editor and see for yourself: GPU cards comparison.json.
Interpretation
From this chart we can get a few insights:
- Integrated graphics processors (IGP) are still useless, even on the latest 11th generation Intel processors. They keep marketing it as "twice as fast as the previous year", but in terms of absolute power, it's less powerful than an entry-level laptop GPU from 2014.
- Laptop GPUs are not bad at all. Overall, a laptop GPU of a certain class is as powerful as a desktop GPU of the same class 1 or 2 generations prior (ie 3-4 years prior). For example the 2021 laptop RTX 3060 is as powerful as a desktop RTX 2060 from 2018. The 2021 laptop RTX 3080 is as powerful as a desktop RTX 1080-Ti from 2017. A more generious comparison would be: an entry-level laptop 1660-Ti GPU from 2019 is more powerful than my mid-level GTX 970 from 2014.
- Laptops GPUs and most desktop GPUs are not ready for 4K gaming. To run AC Valhalla in 4K at 30 fps, you'd need a previous-gen desktop RTX 2080-Ti or higher. Not even a current-gen desktop RTX 2070 can run it. For Cyberpunk 2077, an RTX 3070 can do.
Further work
This chart is a work and progress. I could do a few more things to it:
- Add console performance.
- Add price information. This would become even more relevant once I add consoles.
- Automate information fetching so that I can add more cards easily and even try it on different benchmark tools.
- Add missing Nvidia graphics cards.
- Add AMD graphics cards.
- Add more game thresholds.
- Make it interactive so that people can pick what they want to see. This will become crucial as I add more data.
- Fix the performance threshold for Cyberpunk 2077 for "2k ultra". I meant 4k.
- Produce a similar chart for CPUs.