Profiling a Dart CLI app
I had some trouble finding the docs for it, so I'll give you the right link:
- At https://dart.dev/tools/dart-devtools, they link out to Flutter's CPU profiler.
- https://docs.flutter.dev/development/tools/devtools/cpu-profiler.
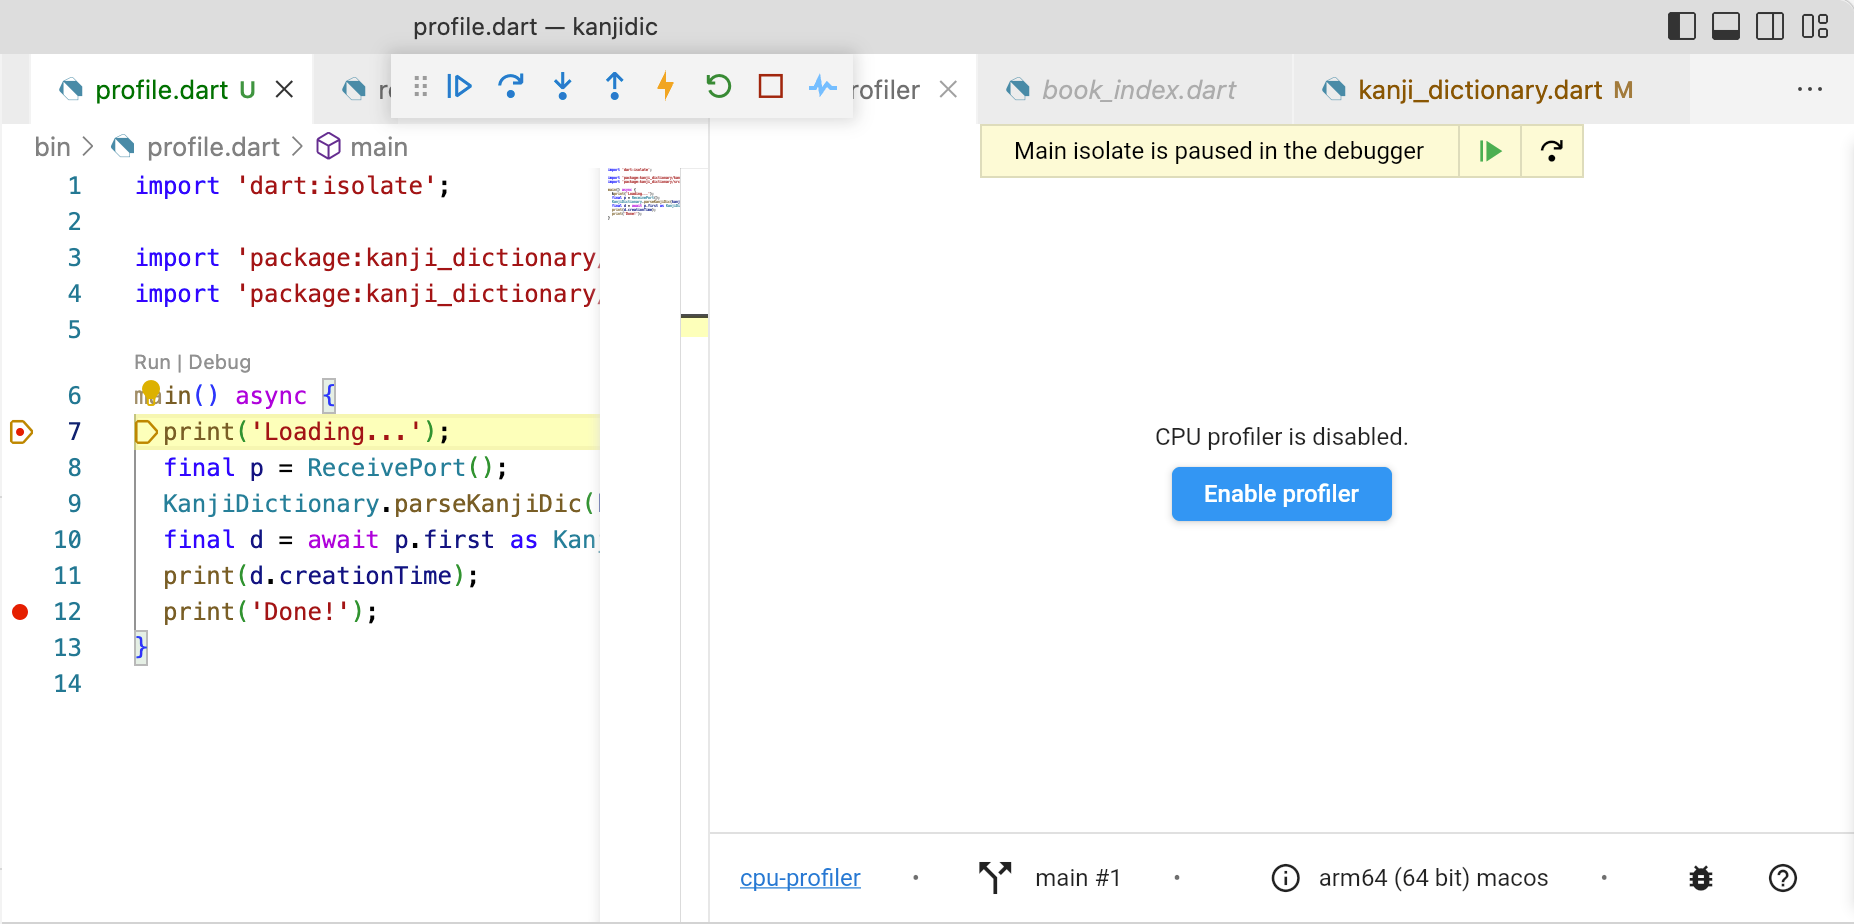
There's a few gotchas. First you need to enable the Profiler after the app has launched. Second, if the app terminates, the Profiler closes as well. Because of that, I had to set up two break points and profile in this manner:
- Run the app in Debug mode.
- When the Debugger stops at the first breakpoint, activate the Profiler and hit Record.
- Resume the Run until you hit the second breakpoint.
- Stop the Profiler, but do not stop the Debugging.
- Analyze the results.
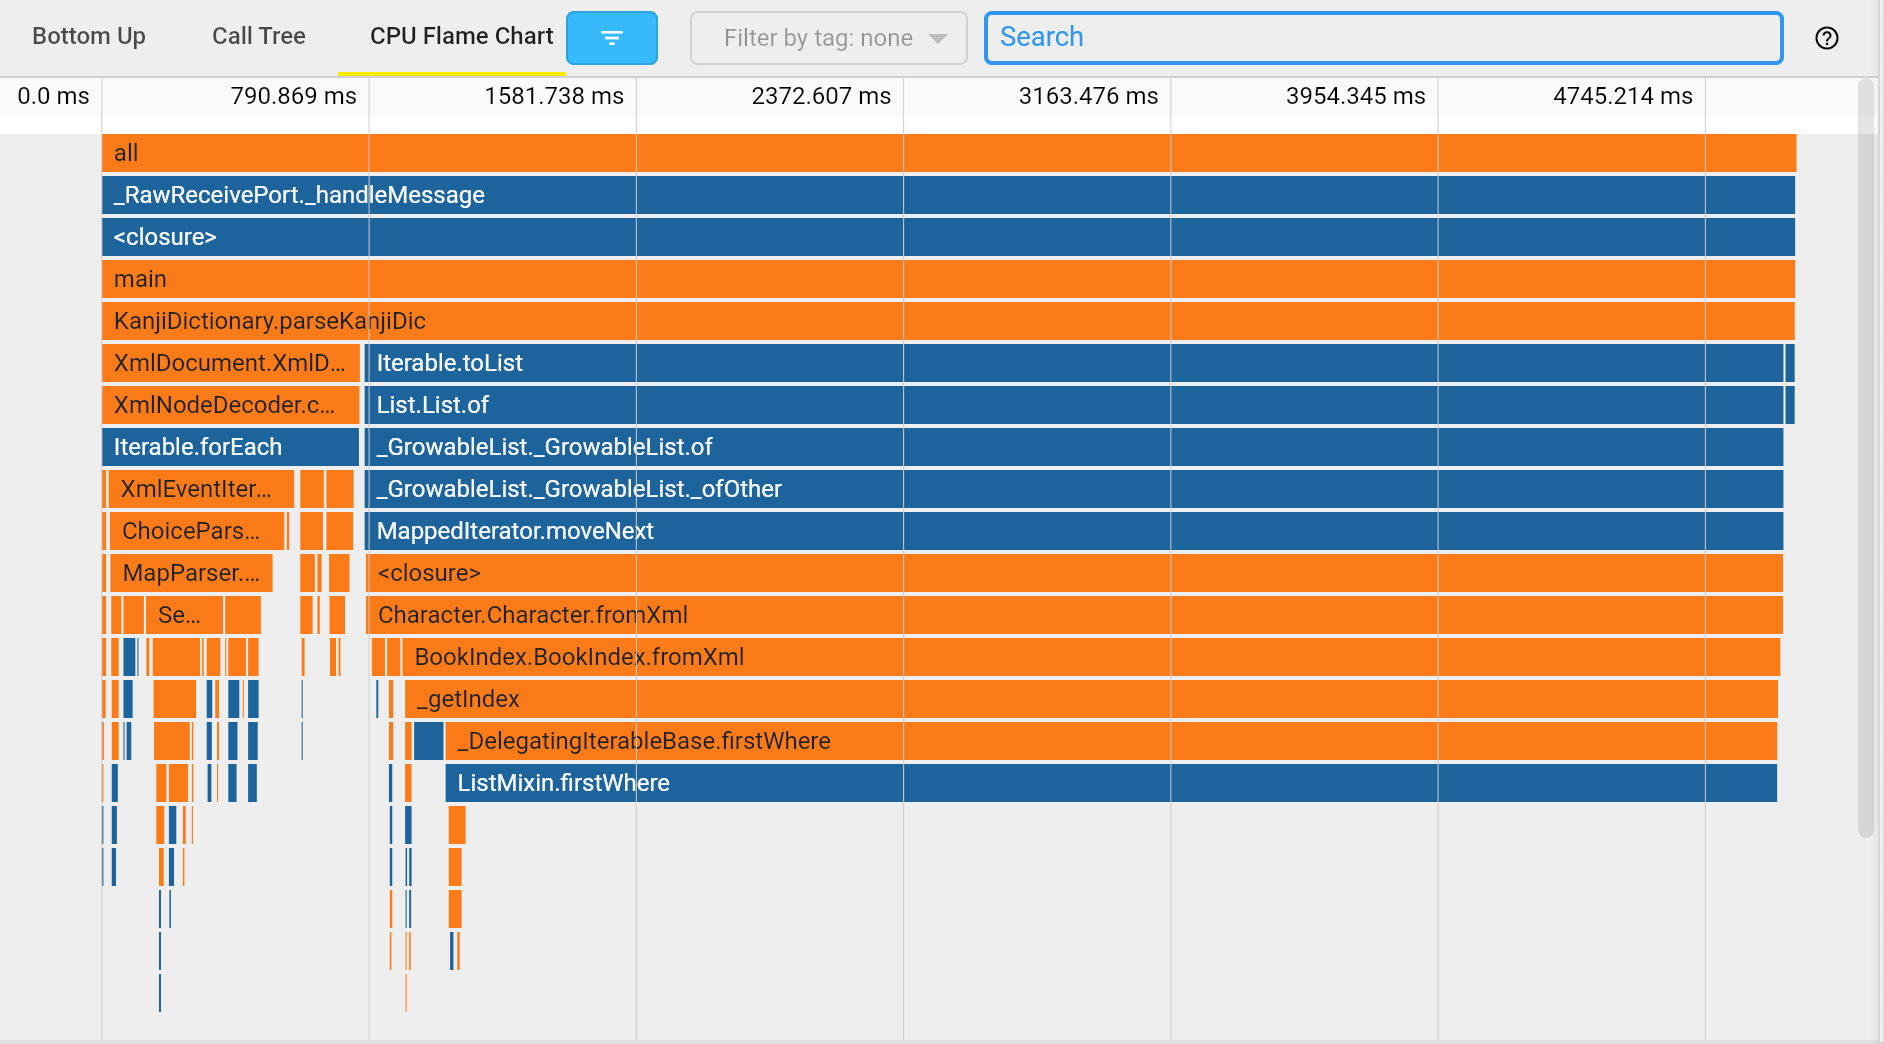
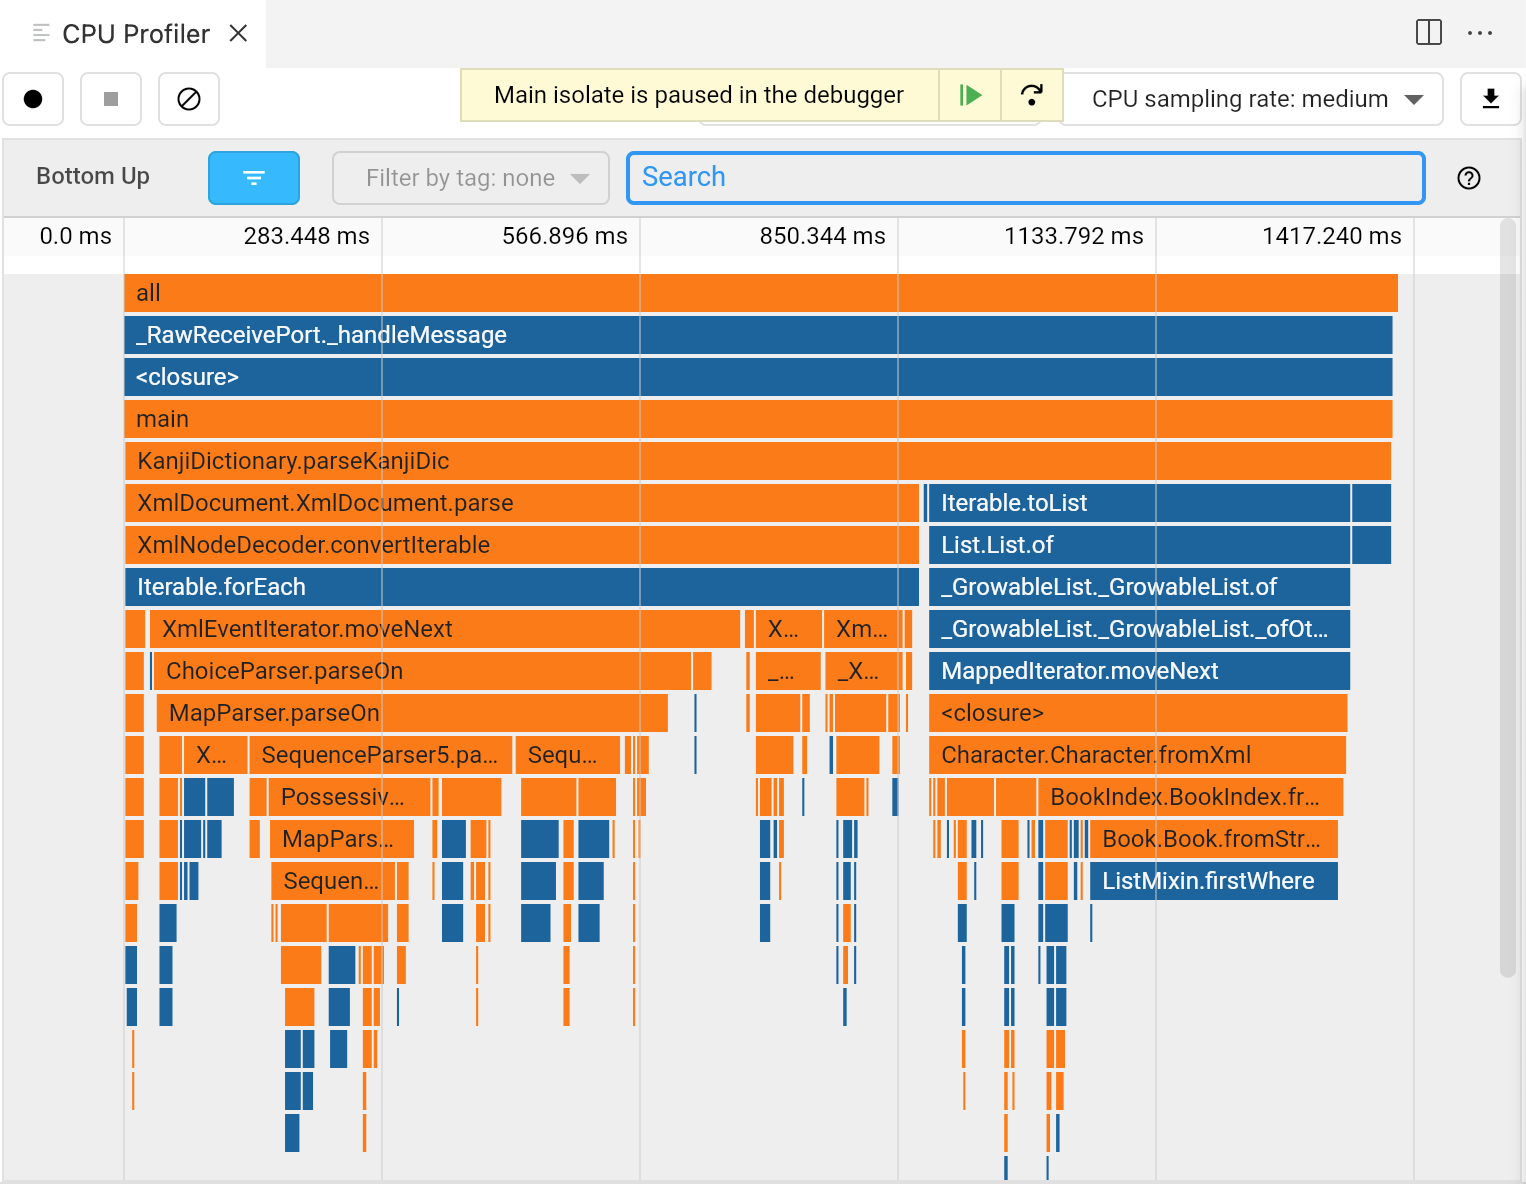
Test after switching from firstWhere to a Map. Before:
factory Book.fromString(String code) =>
    Book.values.firstWhere((l) => l.code == code);
After:
static Map<String, Book> _codeToBook =
    Map.fromEntries(Book.values.map((e) => MapEntry(e.code, e)));

factory Book.fromString(String code) => _codeToBook[code]!;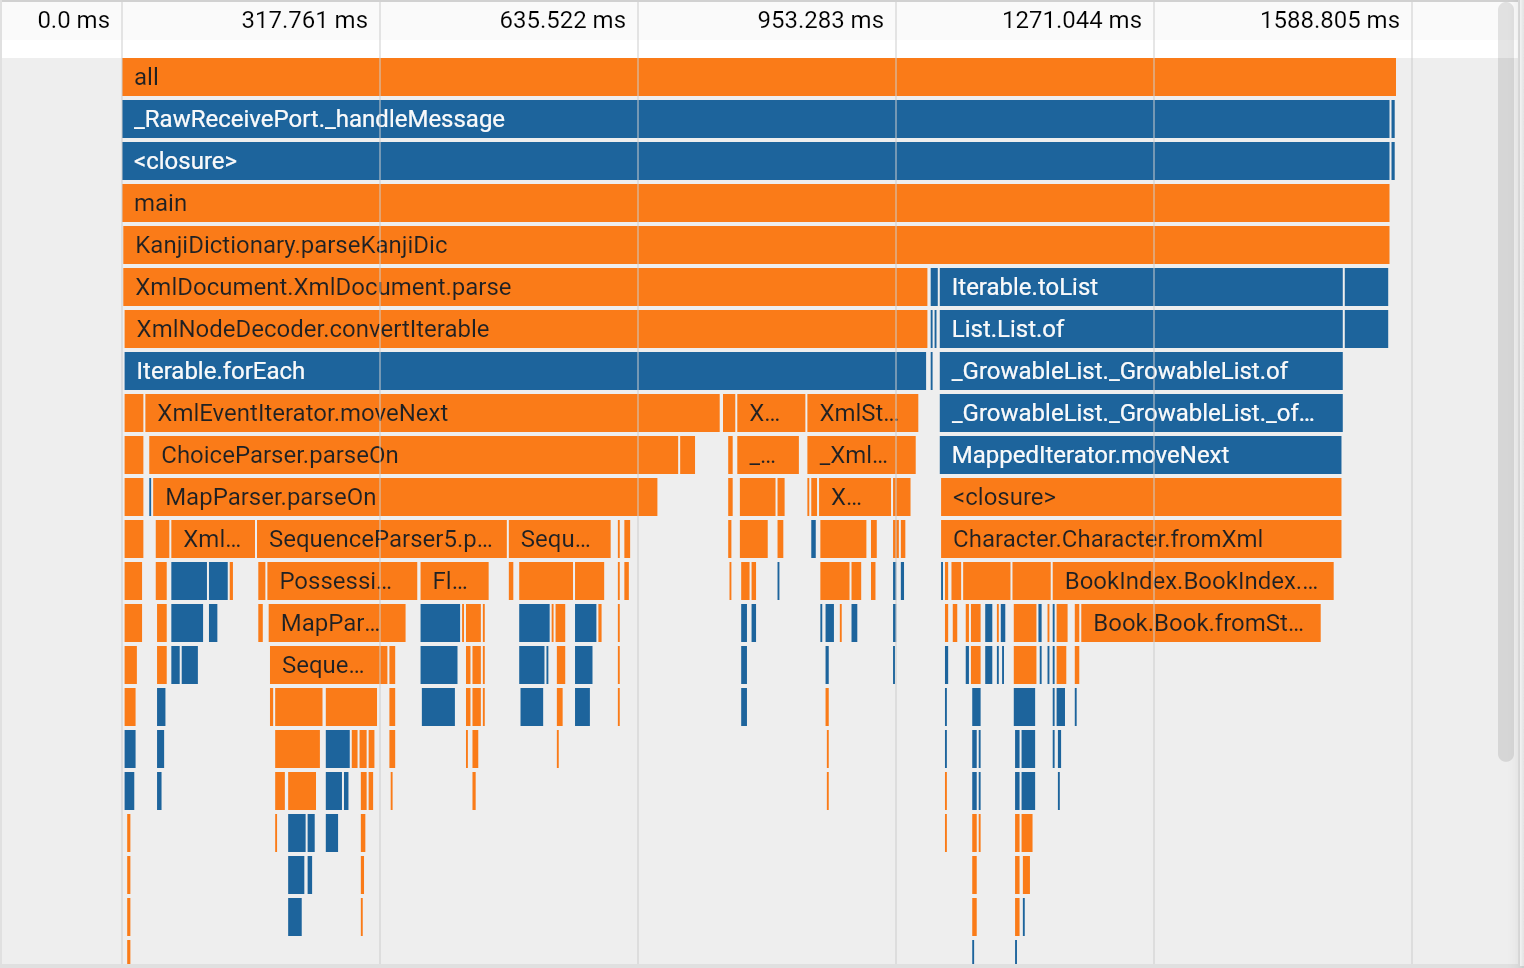
Perhaps the list is too short for Map to be faster. I'll keep the old version then.